
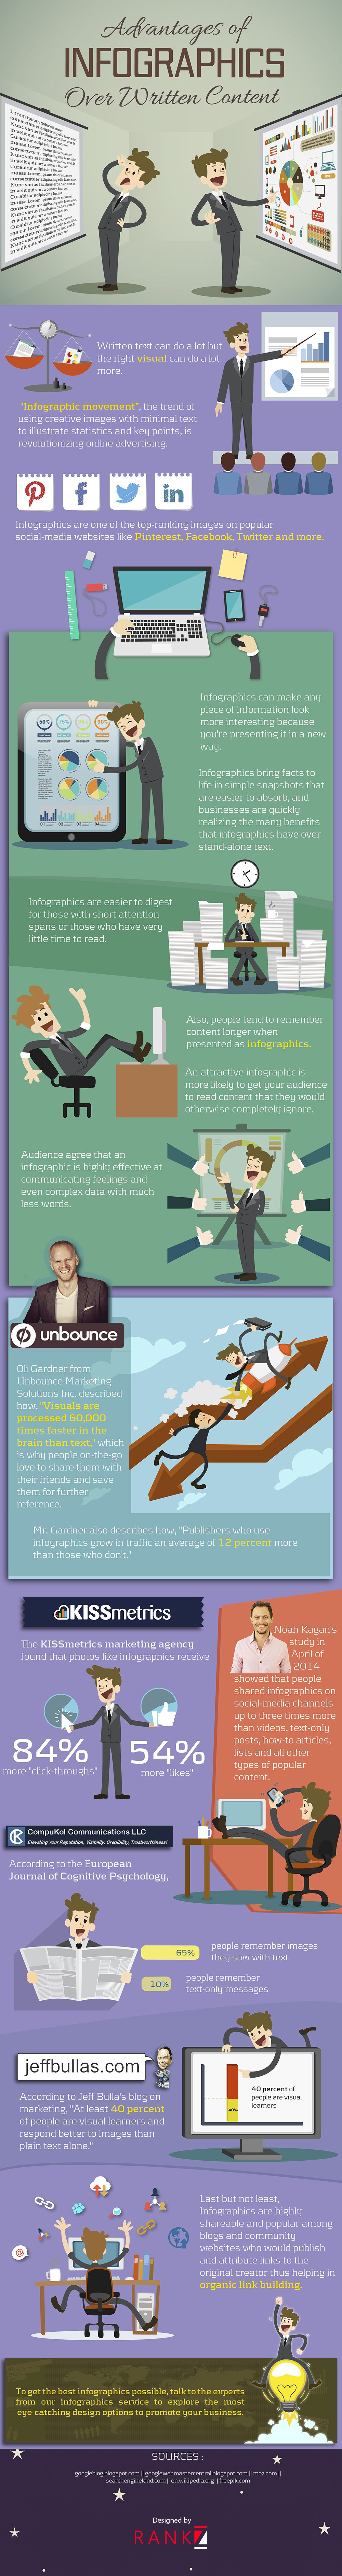
Infographics bring facts to life in simple snapshots that are easier to absorb, and businesses are quickly realizing the many benefits that infographics have over stand-alone text. Here are the top six reasons why you should consider using infographics:
1. An attractive infographic is more likely to get your audience to read content that they would otherwise completely ignore. Infographics are one of the top-ranking images on popular social-media websites like Pinterest, Facebook, Twitter and more. The KISSmetrics marketing agency found that photos like infographics receive 84 percent more “click-throughs” and 54 percent more “likes” than ordinary text posts.
Noah Kagan’s study in April of 2014 showed that people shared infographics on social-media channels up to three times more than videos, text-only posts, how-to articles, lists and all other types of of popular content.
2. Infographics can make any piece of information look more interesting because you’re presenting it in a new way. Audiences agree that an infographic is highly effective at communicating feelings and even complex data with much less words.
3. Infographics are easier to digest for those with short attention spans or those who have very little time to read. Oli Gardner from Unbounce Marketing Solutions Inc. described how, “Visuals are processed 60,000 times faster in the brain than text,” which is why people on-the-go love to share them with their friends and save them for further reference.
4. Mr. Gardner also describes how, “Publishers who use infographics grow in traffic an average of 12 percent more than those who don’t.” This Internet-traffic increase happens because infographics help create visual links that are highly shareable and popular, and they thereby increase the number of visitors coming to your website through organic link building.
Infographics become links when published through an embed code on your website, which should also include social-sharing widgets so that readers can share it more easily. Plus, if you display the HTML code for your infographic, more websites can display it elsewhere with a link back to you.
Remember that the more links you have due to a shared infographic, the better your page ranking becomes in Google searches. Infographics are a great way to improve your search-engine optimization, or overall “SEO.”
5. According to Jeff Bulla’s blog on marketing, “At least 40 percent of people are visual learners and respond better to images than plain text alone.” This fact is part of the reason why he also says, “Statistics from the social network Digg reveal that since 2007, infographics on Digg have increased by 250 times!”
6. People will remember your messages longer when you use infographics. CompuKol Communications L.L.C. reported that according to the European Journal of Cognitive Psychology, studies showed that 65 percent of people remember images they saw with text for at least three days. However, only 10 percent of people remember text-only messages in the same period of time.
Above all, infographics simplify your message in many ways by using attractive images that are rich in meaning. They take a wealth of information and condense it into an appealing, bite-size version that interests more people. You can use them for displaying how-to steps, a time-series list, graphs, relationship flow charts, maps and more. To get the best infographics possible, talk to the experts from our infographics service to explore the most eye-catching design options to promote your business.
Here are the sources, listed in the order in which they appear:
https://blog.kissmetrics.com/more-likes-on-facebook/
http://okdork.com/2014/04/21/why-content-goes-viral-what-analyzing-100-millions-articles-taught-us/
http://unbounce.com/content-marketing/why-do-infographics-make-great-marketing-tools/
http://www.jeffbullas.com/2012/03/07/9-awesome-reasons-to-use-infographics-in-your-content-marketing/
http://www.compukol.com/blog/using-infographics-to-deliver-your-message